Carranglan
Carranglan Kadanglaan | |
|---|---|
| Municipality of Carranglan | |
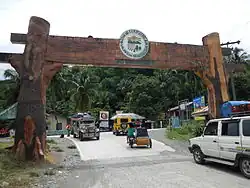 Welcome arch | |
 Flag  Seal | |
 Map of Nueva Ecija with Carranglan highlighted | |
OpenStreetMap | |
.svg.png) Carranglan Location within the Philippines .svg.png) Carranglan Carranglan (Luzon)  Carranglan Carranglan (Nueva Ecija) | |
| Coordinates: 15°57′39″N 121°03′47″E / 15.9608°N 121.0631°E | |
| Country | Philippines |
| Region | Central Luzon |
| Province | Nueva Ecija |
| District | 2nd district |
| Barangays | 17 (see Barangays) |
| Government | |
| • Type | Sangguniang Bayan |
| • Mayor | Rogelio B. Abad |
| • Vice Mayor | Ricardo C. Manucdoc |
| • Representative | Micaela S. Violago |
| • Municipal Council | Members |
| • Electorate | 26,731 voters (2025) |
| Area | |
• Total | 705.31 km2 (272.32 sq mi) |
| Elevation | 305 m (1,001 ft) |
| Highest elevation | 632 m (2,073 ft) |
| Lowest elevation | 210 m (690 ft) |
| Population (2024 census)[3] | |
• Total | 43,694 |
| • Density | 62/km2 (160/sq mi) |
| • Households | 10,440 |
| Economy | |
| • Income class | 1st municipal income class |
| • Poverty incidence | 20.26 |
| • Revenue | ₱ 364.6 million (2022) |
| • Assets | ₱ 765.1 million (2022) |
| • Expenditure | ₱ 277.4 million (2022) |
| • Liabilities | ₱ 107.7 million (2022) |
| Service provider | |
| • Electricity | Nueva Ecija 2 Area 1 Electric Cooperative (NEECO 2 A1) |
| Time zone | UTC+8 (PST) |
| ZIP code | 3123 |
| PSGC | |
| IDD : area code | +63 (0)44 |
| Native languages | Ilocano Tagalog |
Carranglan, officially the Municipality of Carranglan (Ilocano: Ili ti Carranglan; Tagalog: Bayan ng Carranglan), is a municipality in the province of Nueva Ecija, Philippines. According to the 2020 census, it has a population of 42,420 people.[5]
The municipality is home to the Pantabangan–Carranglan Watershed Forest Reserve.

Geography
With an area spanning 705.13 km2, t is the province's largest municipality in terms of land area.
Barangays
Carranglan is politically subdivided into 17 barangays. Each barangay consists of puroks and some have sitios.
- Baluarte (now R.A. Padilla)
- Bantug
- Bunga
- Burgos
- Capintalan
- Digdig (now called Joson)
- General Luna
- Minuli
- Piut
- Puncan
- Putlan
- Salazar
- San Agustin
- T. L. Padilla Pob. (Barangay I)
- F. C. Otic Pob. (Barangay II)
- D. L. Maglanoc Pob. (BarangayIII)
- G. S. Rosario Pob. (Barangay IV)
Climate
| Climate data for Carranglan, Nueva Ecija | |||||||||||||
|---|---|---|---|---|---|---|---|---|---|---|---|---|---|
| Month | Jan | Feb | Mar | Apr | May | Jun | Jul | Aug | Sep | Oct | Nov | Dec | Year |
| Mean daily maximum °C (°F) | 28 (82) | 29 (84) | 30 (86) | 32 (90) | 31 (88) | 30 (86) | 29 (84) | 28 (82) | 29 (84) | 29 (84) | 29 (84) | 28 (82) | 29 (85) |
| Mean daily minimum °C (°F) | 18 (64) | 19 (66) | 20 (68) | 22 (72) | 23 (73) | 23 (73) | 23 (73) | 23 (73) | 23 (73) | 22 (72) | 20 (68) | 19 (66) | 21 (70) |
| Average precipitation mm (inches) | 13 (0.5) | 15 (0.6) | 21 (0.8) | 33 (1.3) | 92 (3.6) | 121 (4.8) | 142 (5.6) | 124 (4.9) | 121 (4.8) | 143 (5.6) | 50 (2.0) | 22 (0.9) | 897 (35.4) |
| Average rainy days | 6.0 | 6.4 | 9.2 | 12.2 | 20.3 | 23.1 | 25.1 | 22.5 | 22.4 | 20.0 | 11.6 | 7.1 | 185.9 |
| Source: Meteoblue (Use with caution: this is modeled/calculated data, not measured locally.)[6] | |||||||||||||
Demographics
| Year | Pop. | ±% p.a. |
|---|---|---|
| 1903 | 1,468 | — |
| 1918 | 2,716 | +4.19% |
| 1939 | 6,339 | +4.12% |
| 1948 | 6,328 | −0.02% |
| 1960 | 10,100 | +3.97% |
| 1970 | 15,536 | +4.39% |
| 1975 | 16,875 | +1.67% |
| 1980 | 19,891 | +3.34% |
| 1990 | 26,064 | +2.74% |
| 1995 | 29,950 | +2.64% |
| 2000 | 31,720 | +1.24% |
| 2007 | 33,233 | +0.64% |
| 2010 | 37,124 | +4.11% |
| 2015 | 41,131 | +1.97% |
| 2020 | 42,420 | +0.65% |
| 2024 | 43,694 | +0.71% |
| Source: Philippine Statistics Authority[7][8][9][10][11] | ||
Economy
Poverty incidence of Carranglan
10 20 30 40 50 60 70 2000 60.88 2003 33.81 2006 38.40 2009 32.34 2012 28.76 2015 17.46 2018 7.68 2021 20.26 Source: Philippine Statistics Authority[12][13][14][15][16][17][18][19] |
Tourism
Education
The Carranglan Schools District Office governs all educational institutions within the municipality. It oversees the management and operations of all private and public, from primary to secondary schools.[20]
Primary and elementary schools
- Abebeg Elementary School
- Baluarte Elementary School
- Bantug Elementary School
- Bunga Elementary School
- Burgos Elementary School
- Camanggahan Elementary School
- Capintalan Elementary School
- Carranglan Central School
- Carranglan United Methodist Church Learning Center
- Daldalayap Elementary School
- Digdig-Joson Elementary School
- Maringalo Elementary School
- Mount Gerizim Christian School
- Nagcancionan Elementary School
- Red Cross Village Elementary School
- Minuli Elementary School
- Obito Elementary School
- Piut Elementary School
- Puncan Elementary School
- Putlan Elementary School
- Salazar Elementary School
- San Agustin Elementary School
Secondary schools
- Binbin Integrated School
- Burgos National High School
- Capintalan High School
- Carranglan National High School
- Digdig High School
- Gen. Luna Integrated School
Gallery
-
.jpg) Spanish-built bridge in Carranglan
Spanish-built bridge in Carranglan -
 Saint Nicolas of Tolentine Parish Church
 -
 Carranglan Municipal Hall
 -
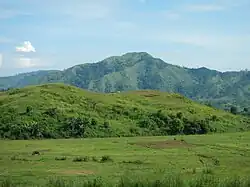 The mountains of Sierra Madre, located east of the municipality
 -
 Carranglan's Gymnasium
 -
 Legislative building
 -
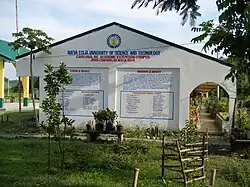 Nueva Ecija University of Science and Technology - Carranglan Off-Campus
 -
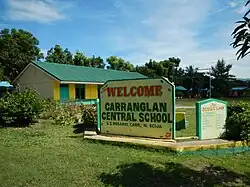 Carranglan Central School

References
- ^ Municipality of Carranglan | (DILG)
- ^ "2015 Census of Population, Report No. 3 – Population, Land Area, and Population Density" (PDF). Philippine Statistics Authority. Quezon City, Philippines. August 2016. ISSN 0117-1453. Archived (PDF) from the original on May 25, 2021. Retrieved July 16, 2021.
- ^ "2024 Census of Population (POPCEN) Population Counts Declared Official by the President". Philippine Statistics Authority. 17 July 2025. Retrieved 18 July 2025.
- ^ "PSA Releases the 2021 City and Municipal Level Poverty Estimates". Philippine Statistics Authority. 2 April 2024. Retrieved 28 April 2024.
- ^ "2024 Census of Population (POPCEN) Population Counts Declared Official by the President". Philippine Statistics Authority. 17 July 2025. Retrieved 18 July 2025.
- ^ "Carranglan: Average Temperatures and Rainfall". Meteoblue. Retrieved 4 May 2020.
- ^ "2024 Census of Population (POPCEN) Population Counts Declared Official by the President". Philippine Statistics Authority. 17 July 2025. Retrieved 18 July 2025.
- ^ Census of Population (2015). "Region III (Central Luzon)". Total Population by Province, City, Municipality and Barangay. Philippine Statistics Authority. Retrieved 20 June 2016.
- ^ Census of Population and Housing (2010). "Region III (Central Luzon)" (PDF). Total Population by Province, City, Municipality and Barangay. National Statistics Office. Retrieved 29 June 2016.
- ^ Censuses of Population (1903–2007). "Region III (Central Luzon)". Table 1. Population Enumerated in Various Censuses by Province/Highly Urbanized City: 1903 to 2007. National Statistics Office.
- ^ "Province of". Municipality Population Data. Local Water Utilities Administration Research Division. Retrieved 17 December 2016.
- ^ "Poverty incidence (PI):". Philippine Statistics Authority. Retrieved December 28, 2020.
- ^ "Estimation of Local Poverty in the Philippines" (PDF). Philippine Statistics Authority. 29 November 2005.
- ^ "2003 City and Municipal Level Poverty Estimates" (PDF). Philippine Statistics Authority. 23 March 2009.
- ^ "City and Municipal Level Poverty Estimates; 2006 and 2009" (PDF). Philippine Statistics Authority. 3 August 2012.
- ^ "2012 Municipal and City Level Poverty Estimates" (PDF). Philippine Statistics Authority. 31 May 2016.
- ^ "Municipal and City Level Small Area Poverty Estimates; 2009, 2012 and 2015". Philippine Statistics Authority. 10 July 2019.
- ^ "PSA Releases the 2018 Municipal and City Level Poverty Estimates". Philippine Statistics Authority. 15 December 2021. Retrieved 22 January 2022.
- ^ "PSA Releases the 2021 City and Municipal Level Poverty Estimates". Philippine Statistics Authority. 2 April 2024. Retrieved 28 April 2024.
- ^ "Masterlist of Schools" (PDF). Department of Education. January 15, 2021. Retrieved August 12, 2025.
External links
- Philippine Standard Geographic Code
- Philippine Census Information
- Local Governance Performance Management System
Places adjacent to Carranglan | |
|---|---|
| Municipalities | |
|---|---|
| Component cities | |