Villevieille
Villevieille | |
|---|---|
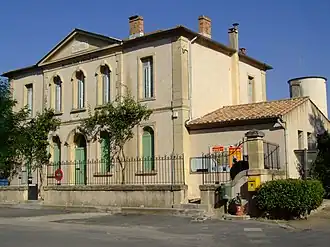 The town hall in Villevieille | |
.svg.png) Coat of arms | |
Location of Villevieille | |
 Villevieille  Villevieille | |
| Coordinates: 43°47′22″N 4°05′50″E / 43.7894°N 4.0972°E | |
| Country | France |
| Region | Occitania |
| Department | Gard |
| Arrondissement | Nîmes |
| Canton | Calvisson |
| Intercommunality | Pays de Sommières |
| Government | |
| • Mayor (2020–2026) | Cécile Marquier[1] |
Area 1 | 8.28 km2 (3.20 sq mi) |
| Population (2022)[2] | 1,874 |
| • Density | 230/km2 (590/sq mi) |
| Time zone | UTC+01:00 (CET) |
| • Summer (DST) | UTC+02:00 (CEST) |
| INSEE/Postal code | 30352 /30250 |
| Elevation | 23–106 m (75–348 ft) (avg. 61 m or 200 ft) |
| 1 French Land Register data, which excludes lakes, ponds, glaciers > 1 km2 (0.386 sq mi or 247 acres) and river estuaries. | |
Villevieille (French pronunciation: [vil.vjɛj]; Occitan: Vilavièlha) is a commune in the Gard department in southern France.
Geography
The village is located on the banks of the Vidourle.
Climate
The climate is hot-summer Mediterranean (Köppen: Csa).[3] On 28 June 2019, during the June 2019 European heat wave, the temperature reached 45.4 °C (113.7 °F) in Villevieille, briefly the highest in French meteorological history, before being surpassed by Gallargues-le-Montueux later the same day.[4][5]
| Climate data for Villevieille (1991−2020 normals, extremes 1970−present) | |||||||||||||
|---|---|---|---|---|---|---|---|---|---|---|---|---|---|
| Month | Jan | Feb | Mar | Apr | May | Jun | Jul | Aug | Sep | Oct | Nov | Dec | Year |
| Record high °C (°F) | 22.4 (72.3) | 24.5 (76.1) | 28.7 (83.7) | 31.4 (88.5) | 35.5 (95.9) | 45.4 (113.7) | 41.6 (106.9) | 40.9 (105.6) | 36.0 (96.8) | 33.1 (91.6) | 26.3 (79.3) | 22.1 (71.8) | 45.4 (113.7) |
| Mean daily maximum °C (°F) | 11.9 (53.4) | 13.3 (55.9) | 16.9 (62.4) | 19.5 (67.1) | 23.7 (74.7) | 28.4 (83.1) | 31.5 (88.7) | 31.2 (88.2) | 26.3 (79.3) | 21.0 (69.8) | 15.6 (60.1) | 12.3 (54.1) | 21.0 (69.8) |
| Daily mean °C (°F) | 6.8 (44.2) | 7.5 (45.5) | 10.7 (51.3) | 13.4 (56.1) | 17.2 (63.0) | 21.3 (70.3) | 24.1 (75.4) | 23.9 (75.0) | 19.6 (67.3) | 15.6 (60.1) | 10.6 (51.1) | 7.4 (45.3) | 14.8 (58.6) |
| Mean daily minimum °C (°F) | 1.8 (35.2) | 1.7 (35.1) | 4.4 (39.9) | 7.2 (45.0) | 10.8 (51.4) | 14.3 (57.7) | 16.6 (61.9) | 16.5 (61.7) | 12.9 (55.2) | 10.2 (50.4) | 5.6 (42.1) | 2.5 (36.5) | 8.7 (47.7) |
| Record low °C (°F) | −13.9 (7.0) | −10.1 (13.8) | −10.7 (12.7) | −2.7 (27.1) | 0.9 (33.6) | 5.1 (41.2) | 7.5 (45.5) | 5.5 (41.9) | 2.2 (36.0) | −2.2 (28.0) | −7.9 (17.8) | −9.7 (14.5) | −13.9 (7.0) |
| Average precipitation mm (inches) | 62.2 (2.45) | 42.5 (1.67) | 47.0 (1.85) | 71.2 (2.80) | 53.1 (2.09) | 39.3 (1.55) | 21.6 (0.85) | 48.8 (1.92) | 107.6 (4.24) | 103.7 (4.08) | 97.8 (3.85) | 66.3 (2.61) | 761.1 (29.96) |
| Average precipitation days (≥ 1.0 mm) | 6.0 | 4.6 | 4.8 | 6.5 | 6.0 | 4.6 | 3.1 | 4.3 | 5.1 | 6.7 | 7.6 | 5.9 | 65.4 |
| Source: Météo-France[6] | |||||||||||||
Demography
| Year | Pop. | ±% |
|---|---|---|
| 1962 | 343 | — |
| 1968 | 507 | +47.8% |
| 1975 | 650 | +28.2% |
| 1982 | 936 | +44.0% |
| 1990 | 1,030 | +10.0% |
| 1999 | 1,196 | +16.1% |
| 2008 | 1,618 | +35.3% |
See also
References
- ^ "Répertoire national des élus: les maires" (in French). data.gouv.fr, Plateforme ouverte des données publiques françaises. 13 September 2022.
- ^ "Populations de référence 2022" (in French). The National Institute of Statistics and Economic Studies. 19 December 2024.
- ^ "Climat Villevieille: Température moyenne Villevieille, diagramme climatique pour Villevieille - Climate-Data.org". fr.climate-data.org. Retrieved 29 June 2019.
- ^ "Temperature in France breaks record as European heat wave continues". BNO News. 28 June 2019.
- ^ "European heatwave: Hottest day ever in France as temp of 45.9C recorded". Sky News. 28 June 2019. Retrieved 28 June 2019.
- ^ "Fiche Climatologique Statistiques 1991-2020 et records" (PDF) (in French). Météo-France. Retrieved 4 September 2022.
Wikimedia Commons has media related to Villevieille.