Sultan sa Barongis
Sultan sa Barongis Lambayong | |
|---|---|
| Municipality of Sultan sa Barongis | |
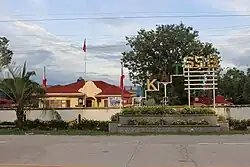 Municipal Hall | |
 Flag  Seal | |
 Map of Maguindanao del Sur with Sultan sa Barongis highlighted | |
OpenStreetMap | |
.svg.png) Sultan sa Barongis Location within the Philippines | |
| Coordinates: 6°48′N 124°38′E / 6.8°N 124.63°E | |
| Country | Philippines |
| Region | Bangsamoro Autonomous Region in Muslim Mindanao |
| Province | Maguindanao del Sur |
| District | Lone district |
| Founded | October 29, 1952 |
| Barangays | 12 (see Barangays) |
| Government | |
| • Type | Sangguniang Bayan |
| • Mayor | Allandatu M. Angas Sr. |
| • Vice Mayor | Al-Fizzar Allandatu M. Angas |
| • Representative | Mohamad P. Paglas Sr. |
| • Municipal Council | Members |
| • Electorate | 16,961 voters (2025) |
| Area | |
• Total | 291.30 km2 (112.47 sq mi) |
| Elevation | 15 m (49 ft) |
| Highest elevation | 36 m (118 ft) |
| Lowest elevation | 6 m (20 ft) |
| Population (2024 census)[3] | |
• Total | 39,182 |
| • Density | 130/km2 (350/sq mi) |
| • Households | 4,011 |
| Economy | |
| • Income class | 2nd municipal income class |
| • Poverty incidence | 49.52 |
| • Revenue | ₱ 177.5 million (2022) |
| • Assets | ₱ 72.73 million (2022) |
| • Expenditure | ₱ 179.5 million (2022) |
| • Liabilities | ₱ 9.358 million (2022) |
| Service provider | |
| • Electricity | Maguindanao Electric Cooperative (MAGELCO) |
| Time zone | UTC+8 (PST) |
| ZIP code | 9611 |
| PSGC | |
| IDD : area code | +63 (0)64 |
| Native languages | Maguindanao Tagalog |
| Website | www |
Sultan sa Barongis, officially the Municipality of Sultan sa Barongis (Maguindanaon: Inged nu Sultan sa Barungis, Jawi: ايڠد نو سولتان س بروڠس;Tagalog: Bayan ng Sultan sa Barongis), is a municipality in the province of Maguindanao del Sur, Philippines. According to the 2020 census, it has a population of 24,476 people.[5]
Lambayong, Cotabato was created through Executive No. 543, signed by then President Elpidio Quirino on October 29, 1952.[6] It is carved from the municipality of Dulawan (now Datu Piang).
Lambayong was changed to its current name on June 21, 1959.[7]
In 2004, 11 barangays of Sultan sa Barongis were transferred to the newly created municipality of Rajah Buayan, reducing the number of barangays from 23 to 12.[8]
Geography
Barangays
Sultan sa Barongis is politically subdivided into 12 barangays. Each barangay consists of puroks while some have sitios.
- Angkayamat
- Barurao
- Bulod
- Darampua
- Gadungan
- Kulambog
- Langgapanan
- Masulot
- Paldong
- Papakan
- Tugal
- Tukanakuden
Climate
| Climate data for Sultan sa Barongis, Maguindanao del Sur | |||||||||||||
|---|---|---|---|---|---|---|---|---|---|---|---|---|---|
| Month | Jan | Feb | Mar | Apr | May | Jun | Jul | Aug | Sep | Oct | Nov | Dec | Year |
| Mean daily maximum °C (°F) | 31 (88) | 31 (88) | 32 (90) | 32 (90) | 31 (88) | 30 (86) | 30 (86) | 30 (86) | 30 (86) | 30 (86) | 30 (86) | 31 (88) | 31 (87) |
| Mean daily minimum °C (°F) | 23 (73) | 23 (73) | 23 (73) | 24 (75) | 24 (75) | 24 (75) | 24 (75) | 24 (75) | 24 (75) | 24 (75) | 24 (75) | 24 (75) | 24 (75) |
| Average precipitation mm (inches) | 64 (2.5) | 45 (1.8) | 59 (2.3) | 71 (2.8) | 140 (5.5) | 179 (7.0) | 192 (7.6) | 198 (7.8) | 163 (6.4) | 147 (5.8) | 113 (4.4) | 66 (2.6) | 1,437 (56.5) |
| Average rainy days | 12.2 | 10.3 | 12.7 | 15.7 | 26.0 | 27.4 | 28.1 | 28.2 | 26.0 | 26.7 | 22.9 | 16.6 | 252.8 |
| Source: Meteoblue (modeled/calculated data, not measured locally)[9] | |||||||||||||
Demographics
| Year | Pop. | ±% p.a. |
|---|---|---|
| 1960 | 40,347 | — |
| 1970 | 45,421 | +1.19% |
| 1975 | 17,630 | −17.29% |
| 1980 | 25,957 | +8.04% |
| 1990 | 29,916 | +1.43% |
| 1995 | 29,967 | +0.03% |
| 2000 | 34,709 | +3.20% |
| 2007 | 25,767 | −4.03% |
| 2010 | 22,547 | −4.74% |
| 2015 | 22,425 | −0.10% |
| 2020 | 24,476 | +1.86% |
| 2024 | 39,182 | +11.96% |
| Source: Philippine Statistics Authority[10][11][12][13][14] | ||
Economy
Poverty Incidence of Sultan sa Barongis
10 20 30 40 50 60 70 80 2000 74.44 2003 54.04 2006 61.80 2009 61.12 2012 66.49 2015 56.43 2018 67.09 2021 49.52 Source: Philippine Statistics Authority[15][16][17][18][19][20][21][22] |
See also
References
- ^ Municipality of Sultan sa Barongis | (DILG)
- ^ "2015 Census of Population, Report No. 3 – Population, Land Area, and Population Density" (PDF). Philippine Statistics Authority. Quezon City, Philippines. August 2016. ISSN 0117-1453. Archived (PDF) from the original on May 25, 2021. Retrieved July 16, 2021.
- ^ "2024 Census of Population (POPCEN) Population Counts Declared Official by the President". Philippine Statistics Authority. July 17, 2025. Retrieved July 18, 2025.
- ^ "PSA Releases the 2021 City and Municipal Level Poverty Estimates". Philippine Statistics Authority. April 2, 2024. Retrieved April 28, 2024.
- ^ "2024 Census of Population (POPCEN) Population Counts Declared Official by the President". Philippine Statistics Authority. July 17, 2025. Retrieved July 18, 2025.
- ^ "Executive Order No. 543, s. 1952 | GOVPH".
- ^ Republic Act No. 2587, Chan Robles, retrieved 2012
- ^ National Statistical Coordination Board (October 25, 2004). "2004 Factsheet (August 1-September 30, 2004)". Archived from the original on September 16, 2006. Retrieved June 24, 2006.
- ^ "Sultan sa Barongis, Maguindanao : Average Temperatures and Rainfall". Meteoblue. Retrieved January 19, 2019.
- ^ "2024 Census of Population (POPCEN) Population Counts Declared Official by the President". Philippine Statistics Authority. July 17, 2025. Retrieved July 18, 2025.
- ^ Census of Population (2015). Highlights of the Philippine Population 2015 Census of Population. Philippine Statistics Authority. Retrieved June 20, 2016.
- ^ Census of Population and Housing (2010). Population and Annual Growth Rates for The Philippines and Its Regions, Provinces, and Highly Urbanized Cities (PDF). National Statistics Office. Retrieved June 29, 2016.
- ^ Censuses of Population (1903–2007). Table 1. Population Enumerated in Various Censuses by Region: 1903 to 2007. National Statistics Office.
- ^ "Province of". Municipality Population Data. Local Water Utilities Administration Research Division. Retrieved December 17, 2016.
- ^ "Poverty incidence (PI)". Philippine Statistics Authority. Retrieved December 28, 2020.
- ^ "Estimation of Local Poverty in the Philippines" (PDF). Philippine Statistics Authority. November 29, 2005.
- ^ "2003 City and Municipal Level Poverty Estimates" (PDF). Philippine Statistics Authority. March 23, 2009.
- ^ "City and Municipal Level Poverty Estimates; 2006 and 2009" (PDF). Philippine Statistics Authority. August 3, 2012.
- ^ "2012 Municipal and City Level Poverty Estimates" (PDF). Philippine Statistics Authority. May 31, 2016.
- ^ "Municipal and City Level Small Area Poverty Estimates; 2009, 2012 and 2015". Philippine Statistics Authority. July 10, 2019.
- ^ "PSA Releases the 2018 Municipal and City Level Poverty Estimates". Philippine Statistics Authority. December 15, 2021. Retrieved January 22, 2022.
- ^ "PSA Releases the 2021 City and Municipal Level Poverty Estimates". Philippine Statistics Authority. April 2, 2024. Retrieved April 28, 2024.
External links
- Sultan sa Barongis Profile at the DTI Cities and Municipalities Competitive Index
- Philippine Standard Geographic Code
- Local Governance Performance Management System
Places adjacent to Sultan sa Barongis | ||||||||||||||||
|---|---|---|---|---|---|---|---|---|---|---|---|---|---|---|---|---|
| ||||||||||||||||