Enrique Villanueva
Enrique Villanueva Talingting | |
|---|---|
| Municipality of Enrique Villanueva | |
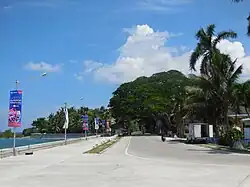 Island Circumferential Road | |
 Flag Seal | |
 Map of Siquijor with Enrique Villanueva highlighted | |
OpenStreetMap | |
.svg.png) Enrique Villanueva Location within the Philippines | |
| Coordinates: 9°16′34″N 123°38′49″E / 9.276°N 123.647°E | |
| Country | Philippines |
| Region | Negros Island Region |
| Province | Siquijor |
| District | Lone district |
| Founded | April 1924 |
| Barangays | 14 (see Barangays) |
| Government | |
| • Type | Sangguniang Bayan |
| • Mayor | Ruth B. Aque (PFP) |
| • Vice Mayor | Gerold V. Pal-ing (PFP) |
| • Representative | Zaldy Villa (Lakas) |
| • Municipal Council | Members |
| • Electorate | 6,035 voters (2025) |
| Area | |
• Total | 28.60 km2 (11.04 sq mi) |
| Elevation | 26 m (85 ft) |
| Highest elevation | 602 m (1,975 ft) |
| Lowest elevation | 0 m (0 ft) |
| Population (2024 census)[3] | |
• Total | 6,965 |
| • Density | 240/km2 (630/sq mi) |
| • Households | 1,653 |
| Economy | |
| • Income class | 5th municipal income class |
| • Poverty incidence | 9.04 |
| • Revenue | ₱ 84.82 million (2022) |
| • Assets | ₱ 191.6 million (2022) |
| • Expenditure | ₱ 66.56 million (2022) |
| • Liabilities | ₱ 38.63 million (2022) |
| Service provider | |
| • Electricity | Province of Siquijor Electric Cooperative (PROSIELCO) |
| Time zone | UTC+8 (PST) |
| ZIP code | 6230 |
| PSGC | |
| IDD : area code | +63 (0)35 |
| Native languages | Cebuano Tagalog |
| Patron saint | Our Lady of Mount Carmel |
Enrique Villanueva, officially the Municipality of Enrique Villanueva (Cebuano: Lungsod sa Enrique Villanueva; Tagalog: Bayan ng Enrique Villanueva), is a municipality in the province of Siquijor, Philippines. According to the 2020 census, it has a population of 6,790 people, making it the least populated town in the province.[5]
Enrique Villanueva is 22 kilometres (14 mi) from Siquijor.
Geography
Barangays
Enrique Villanueva is politically subdivided into 14 barangays. Each barangay consists of puroks and some have sitios.
| PSGC | Barangay | Population | ±% p.a. | |||
|---|---|---|---|---|---|---|
| 2024[6] | 2010[7] | |||||
| 076101001 | Balolong | 2.1% | 145 | 149 | −0.19% | |
| 076101002 | Bino‑ongan | 7.2% | 498 | 438 | 0.90% | |
| 076101003 | Bitaug | 14.5% | 1,012 | 828 | 1.41% | |
| 076101004 | Bolot | 2.9% | 202 | 137 | 2.75% | |
| 076101005 | Camogao | 5.1% | 352 | 313 | 0.82% | |
| 076101006 | Cangmangki | 6.4% | 449 | 412 | 0.60% | |
| 076101007 | Libo | 13.5% | 938 | 798 | 1.14% | |
| 076101008 | Lomangcapan | 10.7% | 744 | 621 | 1.27% | |
| 076101009 | Lotloton | 7.1% | 492 | 467 | 0.37% | |
| 076101010 | Manan‑ao | 2.6% | 180 | 135 | 2.03% | |
| 076101011 | Olave | 3.0% | 208 | 191 | 0.60% | |
| 076101012 | Parian | 3.0% | 206 | 216 | −0.33% | |
| 076101013 | Poblacion | 7.6% | 530 | 464 | 0.93% | |
| 076101014 | Tulapos | 12.0% | 834 | 803 | 0.27% | |
| Total | 6,965 | 5,972 | 1.08% | |||
Climate
| Climate data for Enrique Villanueva, Siquijor | |||||||||||||
|---|---|---|---|---|---|---|---|---|---|---|---|---|---|
| Month | Jan | Feb | Mar | Apr | May | Jun | Jul | Aug | Sep | Oct | Nov | Dec | Year |
| Mean daily maximum °C (°F) | 30 (86) | 30 (86) | 31 (88) | 33 (91) | 32 (90) | 31 (88) | 30 (86) | 30 (86) | 30 (86) | 30 (86) | 30 (86) | 30 (86) | 31 (87) |
| Mean daily minimum °C (°F) | 22 (72) | 22 (72) | 22 (72) | 23 (73) | 24 (75) | 25 (77) | 24 (75) | 24 (75) | 24 (75) | 24 (75) | 23 (73) | 23 (73) | 23 (74) |
| Average precipitation mm (inches) | 26 (1.0) | 22 (0.9) | 28 (1.1) | 41 (1.6) | 95 (3.7) | 136 (5.4) | 147 (5.8) | 126 (5.0) | 132 (5.2) | 150 (5.9) | 98 (3.9) | 46 (1.8) | 1,047 (41.3) |
| Average rainy days | 7.5 | 6.7 | 8.9 | 10.4 | 21.6 | 25.6 | 26.3 | 25.0 | 24.1 | 26.2 | 19.2 | 12.1 | 213.6 |
| Source: Meteoblue (modeled/calculated data, not measured locally)[8] | |||||||||||||
Demographics
|
|
| |||||||||||||||||||||||||||||||||||||||||||||||||||
| Source: Philippine Statistics Authority[9][10][7][11][12] | |||||||||||||||||||||||||||||||||||||||||||||||||||||
Economy
Poverty incidence of Enrique Villanueva
10 20 30 40 50 2000 28.41 2003 43.16 2006 29.80 2009 28.22 2012 19.77 2015 23.00 2018 14.40 2021 9.04 Source: Philippine Statistics Authority[13][14][15][16][17][18][19][20] |
Education
The public schools in the town of Enrique Villanueva are administered by one school district under the Schools Division of Siquijor.
Elementary schools:
- Bitaug Elementary School — Bitaug
- Enrique Villanueva Central Elementary School — Tulapos
- Libo Elementary School — Libo
- Roxas Elementary School — Cangmangki
High schools:
- Enrique Villanueva National High School — Tulapos
Image gallery
-
 Mount Carmel Parish Church
 -
 Enrique Villanueva Town Hall
 -
 The Tulapos Marine Sanctuary
References
- ^ Municipality of Enrique Villanueva | (DILG)
- ^ "2015 Census of Population, Report No. 3 – Population, Land Area, and Population Density" (PDF). Philippine Statistics Authority. Quezon City, Philippines. August 2016. ISSN 0117-1453. Archived (PDF) from the original on May 25, 2021. Retrieved July 16, 2021.
- ^ "2024 Census of Population (POPCEN) Population Counts Declared Official by the President". Philippine Statistics Authority. 17 July 2025. Retrieved 18 July 2025.
- ^ "PSA Releases the 2021 City and Municipal Level Poverty Estimates". Philippine Statistics Authority. 2 April 2024. Retrieved 28 April 2024.
- ^ "2024 Census of Population (POPCEN) Population Counts Declared Official by the President". Philippine Statistics Authority. 17 July 2025. Retrieved 18 July 2025.
- ^ Census of Population (2020). "Region VII (Central Visayas)". Total Population by Province, City, Municipality and Barangay. Philippine Statistics Authority. Retrieved 8 July 2021.
- ^ a b Census of Population and Housing (2010). "Region VII (Central Visayas)" (PDF). Total Population by Province, City, Municipality and Barangay. National Statistics Office. Retrieved 29 June 2016.
- ^ "Enrique Villanueva: Average Temperatures and Rainfall". Meteoblue. Retrieved 28 April 2020.
- ^ "2024 Census of Population (POPCEN) Population Counts Declared Official by the President". Philippine Statistics Authority. 17 July 2025. Retrieved 18 July 2025.
- ^ Census of Population (2015). "Region VII (Central Visayas)". Total Population by Province, City, Municipality and Barangay. Philippine Statistics Authority. Retrieved 20 June 2016.
- ^ Censuses of Population (1903–2007). "Region VII (Central Visayas)". Table 1. Population Enumerated in Various Censuses by Province/Highly Urbanized City: 1903 to 2007. National Statistics Office.
- ^ "Province of". Municipality Population Data. Local Water Utilities Administration Research Division. Retrieved 17 December 2016.
- ^ "Poverty incidence (PI):". Philippine Statistics Authority. Retrieved December 28, 2020.
- ^ "Estimation of Local Poverty in the Philippines" (PDF). Philippine Statistics Authority. 29 November 2005.
- ^ "2003 City and Municipal Level Poverty Estimates" (PDF). Philippine Statistics Authority. 23 March 2009.
- ^ "City and Municipal Level Poverty Estimates; 2006 and 2009" (PDF). Philippine Statistics Authority. 3 August 2012.
- ^ "2012 Municipal and City Level Poverty Estimates" (PDF). Philippine Statistics Authority. 31 May 2016.
- ^ "Municipal and City Level Small Area Poverty Estimates; 2009, 2012 and 2015". Philippine Statistics Authority. 10 July 2019.
- ^ "PSA Releases the 2018 Municipal and City Level Poverty Estimates". Philippine Statistics Authority. 15 December 2021. Retrieved 22 January 2022.
- ^ "PSA Releases the 2021 City and Municipal Level Poverty Estimates". Philippine Statistics Authority. 2 April 2024. Retrieved 28 April 2024.
External links
- Philippine Standard Geographic Code
- "Municipality of Enrique Villanueva". Provincial Government of Siquijor. Archived from the original on January 2, 2012.
Siquijor (capital and largest municipality) | |
| Municipalities | |
.svg.png)