Indigenous peoples in Guatemala
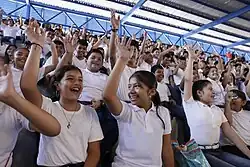 Indigenous girls in Retalhuleu Department | |
| Total population | |
|---|---|
| 6,471,670 (2018 census)[1] 43.43% of the Guatemalan population | |
| Languages | |
| Spanish, Mayan languages | |
| Related ethnic groups | |
| Mayans (Kʼicheʼ, Kekchi, Kaqchikel, Mam, and others) Ladino Garifuna Xinca |
The Indigenous peoples in Guatemala, also known as Native Guatemalans, are the original inhabitants of Guatemala, predating Spanish colonization. Guatemala is home to about 6.5 million (43.75%) people of indigenous heritage belonging to the 22 Mayan peoples (Achi’, Akatec, Awakatec, Chalchitec, Ch’ortí, Chuj, Itzá, Ixil, Jacaltec, Kaq- chikel, K’iche, Mam, Mopan, Poqomam, Poqomchí, Q’anjob’al, Q’eqchí, Sakapultec, Sipakapense, Tektitek, Tz’utujil and Us- pantek), Garífuna and Xinca.[2] The Maya are the largest Indigenous population in Guatemala.[3]
Table of ethnicities
The following is a table of native populations by department in Guatemala.
| Department | Ethnic groups | Pop. (Indigenous) | % of pop. | |
|---|---|---|---|---|
| 1 | Q'eqchi', Poqomchi' | 1,129,369 | 92.9% | |
| 2 | Kʼicheʼ, Ixil | 846,500 | 89.1% | |
| 3 | Mam, Qʼanjobʼal, Jakaltek | 760,871 | 64.9% | |
| 4 | Kaqchikel | 481,335 | 78.1% | |
| 5 | Kʼicheʼ, Mam | 410,195 | 97.9% | |
| 6 | Kʼicheʼ, Mam | 406,491 | 50.8% | |
| 7 | Kʼicheʼ, Kakchikel, Tz'utujil | 406,295 | 96.3% | |
| 8 | Kaqchikel | 402,376 | 13.3% | |
| 9 | Mam | 318,093 | 30.8% | |
| 10 | Kʼicheʼ | 211,103 | 38.1% | |
| 11 | Achi | 179,746 | 59.9% | |
| 12 | Q'eqchi' | 164,814 | 30.2% | |
| 13 | Kaqchikel | 132,762 | 40.1% | |
| 14 | Q'eqchi' | 115,296 | 28.3% | |
| 15 | Chʼortiʼ | 111,368 | 26.8% | |
| 16 | K'iche' | 48,871 | 14.9% | |
| 17 | Poqomam | 37,100 | 5.1% | |
| 18 | Poqomam | 24,891 | 7.2% | |
| 19 | Xinca | 7,863 | 1.9% | |
| 20 | 4,769 | 1.9% | ||
| 21 | Xinca | 4,768 | 0.97% | |
| 22 | 2,627 | 1.4% | ||
| 6,207,503 | 41.6% |
See also
References
- ^ "Resultados del Censo 2018". INE. 2018. Archived from the original on 2020-04-16. Retrieved 2025-05-18.
- ^ Guatemala - IWGIA - International Work Group for Indigenous Affairs
- ^ "Indigenous Peoples". United States Agency for International Development. Archived from the original on April 20, 2023. Retrieved 2024-11-17.
- ^ Resultados Censo 2018 (PDF) (Report) (in Spanish). Instituto Nacional de Estadística Guatemala. Dec 2019. p. 112. Retrieved 5 June 2025.
Ancestral background of Guatemalan citizens | |
| Guatemalan native groups (Maya and others) | |
| Former and extinct | |
| Guatemalan mestizo | |
| Descendants of Europeans (white or Criollo) | |
| Descendants of Asians | |
| Afro-descendants | |
| Americas | |
| Pre-history | .svg.png) | ||||||||||
|---|---|---|---|---|---|---|---|---|---|---|---|
| Mythology/Religion |
| ||||||||||
| Culture |
| ||||||||||
| European colonization | |||||||||||
| Modern groups by country |
| ||||||||||
| Related topics | |||||||||||
| |||||||||||