The mayor of Genoa (Italian : sindaco di Genova ) is an elected politician who, along with the Genoa City Council of 40 members, is accountable for the strategic government of the municipality of Genoa , Liguria , Italy .
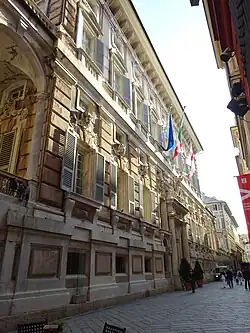
Palazzo Doria-Tursi , Genoa City Hall.
List of Mayors of Genoa
In 1848 the Kingdom of Piedmont-Sardinia created the office of the Mayor of Genoa (Sindaco di Genova ), chosen by Genoa citizens.
Mayor Term start Term end Party 1 Antonio Profumo 15 March 1849 22 December 1851 Right 2 Stefano Centurione 22 December 1851 1 March 1853 Right 3 Domenico Elena 1 March 1853 22 October 1856 Right 4 Giuseppe Morro 22 October 1856 25 February 1860 Right 5 Ludovico Pallavicino 25 February 1860 12 December 1860 Right 6 Gerolamo Gavotti 12 December 1860 26 December 1861 Right
In 1861 the Kingdom of Italy continued the previous office, chosen by the City council. In 1926, the Fascist dictatorship abolished mayors and City councils, replacing them with an authoritarian Podestà National Fascist Party .
From 1945 to 1993, the Mayor of Genoa was chosen by the City Council.
Mayor Term start Term end Party Coalition Election 1 Giovanni Tarello 4 December 1946 23 February 1948 PCI PCI • PSI 1946 2 Gelasio Adamoli 23 February 1948 16 June 1951 PCI 3 Vittorio Pertusio 16 June 1951 2 July 1956 DC DC 1951 2 July 1956 27 May 1960 1956 - Special Prefectural Commissioner tenure (27 May 1960–8 February 1961) [ a] (3) Vittorio Pertusio 8 February 1961 2 February 1965 DC DC 1960 4 Augusto Pedullà 2 February 1965 5 January 1966 DC 1964 - Special Prefectural Commissioner tenure (5 January 1966–14 July 1966) [ b] (4) Augusto Pedullà 14 July 1966 15 October 1971 DC DC • PSI 1966 5 Giancarlo Piombino 15 October 1971 2 April 1975 DC 1971 6 Fulvio Cerofolini 2 April 1975 2 August 1976 PSI PCI • PSI 2 August 1976 21 September 1981 1976 21 September 1981 13 October 1985 PCI • PSI • PSDI [ c] 1981 7 Cesare Campart 13 October 1985 2 August 1990 PRI DC • PSI • PSDI • PRI • PLI 1985 8 Romano Merlo 2 August 1990 3 December 1992 PSDI PCI • PSI • PSDI • PRI 1990 9 Claudio Burlando 3 December 1992 19 May 1993 PDS PDS • PSI • PSDI - Special Prefectural Commissioner tenure (19 May 1993 – 7 December 1993) [ d]
Notes ^ Nominated by the Prefect after the City Council failed to elect a new Mayor after the resignation of the previous one. ^ Nominated by the Prefect after the City Council failed to elect a new Mayor after the resignation of the previous one. ^ With the external support of the Radical Party and the Proletarian Unity Party (PdUP). ^ Nominated by the Prefect after the Mayor and the members of the City Council resigned in order to hold a new election under the provision of the new local electoral law.
Since 1993, under provisions of new local administration law, the Mayor of Genoa is chosen by direct election, originally every four then every five years.
Notes
Timeline
Elections
The election took place in two rounds: the first on 21 November, the second on 5 December 1993.
Results
Summary of the 1993 Genoa City Council election results Parties and coalitions Votes % Seats Democratic Party of the Left (Partito Democratico della Sinistra ) PDS 98,026 26.19% 22 Federation of the Greens (Federazione dei Verdi ) FdV 13,227 3.55% 3 Democratic Alliance (Alleanza Democratica ) AD 12,255 3.27% 2 Pannella List (Lista Pannella ) LP 7,962 2.13% 1 The Network (La Rete ) LR 6,558 1.75% 1 Others 5,765 1.54% 1 Sansa coalition (Left-wing ) 143,843 38.43% 30 Lega Nord LN 108,562 29.01% 10 Christian Democracy (Democrazia Cristiana ) DC 33,604 8.98% 4 Socialist Rebirth (Rinascita Socialista ) RS 14,840 3.96% 1 Union of the Centre (Unione di Centro ) UdC 6,975 1.86% 0 Signorini coalition (Centre ) 55,419 14.81% 5 Communist Refoundation Party (Rifondazione Comunista ) PRC 32,238 8.61% 3 Italian Social Movement (Movimento Sociale Italiano ) MSI-DN 25,213 6.74% 2 Others 9,004 2.41% 0 Total 374,279 100% 50 Votes cast / turnout 472,436 78.93% Registered voters 598,584 Source: Ministry of the Interior
Candidate Party Coalition First round Second round Votes % Votes % Adriano Sansa Ind Progressives 189,874 42.93 247,547 59.17 Enrico Serra LN 116,973 26.45 170,799 40.83 Ugo Signorini DC DC -RS -UdC 66,387 15.01 Giuliano Boffardi PRC 32,498 7.35 Vincenzo Plinio MSI-DN 27,252 6.16 Others 9,260 2.10 Eligible voters 598,584 100.00 598,584 100.00 Voted 472,436 78.93 439,769 73.47 Blank or invalid ballots 30,192 21,423 Total valid votes 442,244 418,346
The election took place on two rounds: the first on 16 November, the second on 30 November 1997.
Results
Summary of the 1997 Genoa City Council election results Parties and coalitions Votes % Seats Democratic Party of the Left (Partito Democratico della Sinistra ) PDS 84,635 25.91% 17 Communist Refoundation Party (Rifondazione Comunista )[ a] PRC 31,093 9.52% 6 Italian People's Party (Partito Popolare Italiano ) PPI 19,965 6.11% 4 Italian Renewal (Rinnovamento Italiano ) RI 6,223 1.91% 1 Others 10,018 3.06% 2 Pericu coalition (Centre-left ) 151,934 46.51% 30 Forza Italia FI 42,170 12.91% 6 National Alliance (Alleanza Nazionale ) AN 18,265 5.59% 2 Christian Democratic Centre (Centro Cristiano Democratico ) CCD 7,524 2.30% 0 Eva coalition (Centre-right ) 67,959 20.80% 8 New Genoa (Genova Nuova ) GN 55,947 17.13% 7 Sansa for Genoa (Sansa per Genova ) SpG 36,186 11.08% 4 Lega Nord LN 11,481 3.51% 1 Others 3,155 0.97% 0 Total 326,662 100.00% 50 Votes cast / turnout 400,823 69.88% Registered voters 573,607 Source: Ministry of the Interior
Candidate Party Coalition First round Second round Votes % Votes % Giuseppe Pericu PDS The Olive Tree 129,680 34.38 170,211 51.52 Sergio Castellaneta GN 75,042 19.90 160,140 48.48 Claudio Eva FI Pole for Freedoms 73,979 19.61 Adriano Sansa SpG 51,904 13.76 Giordano Bruschi PRC 31,809 8.43 Giacomo Chiappori LN 11,265 2.99 Others 3,505 0.93 Eligible voters 573,607 100.00 573,607 100.00 Voted 400,823 69.88 341,362 59.51 Blank or invalid ballots 23,639 11,011 Total valid votes 377,184 330,351
Notes ^ Officially endorsed the centre-left candidate only on the second round.
The election took place on 26 May 2002.
Results
Summary of the 2002 Genoa City Council election results Parties and coalitions Votes % Seats Democrats of the Left (Democratici di Sinistra ) DS 102,944 35.19% 20 The Daisy (La Margherita ) DL 27,166 9.29% 5 Communist Refoundation Party (Rifondazione Comunista ) PRC 21,369 7.30% 4 Federation of the Greens (Federazione dei Verdi ) FdV 6,399 2.19% 1 Party of Italian Communists (Comunisti Italiani ) PdCI 5,176 1.77% 1 Others 9,691 3.32% 0 Pericu coalition (Centre-left ) 172,745 59.05% 31 Forza Italia FI 49,609 16.96% 9 National Alliance (Alleanza Nazionale ) AN 17,121 5.85% 3 Union of the Centre (Unione di Centro ) UDC 6,867 2.35% 1 Magnani coalition (Centre-right ) 73,597 25.16% 13 New Genoa (Genova Nuova ) GN 23,198 7.93% 5 Lega Nord LN 9,405 3.22% 1 Castellaneta coalition 32,603 11.15% 6 Others 13,585 4.64% 0 Total 292,530 100.00% 50 Votes cast / turnout 367,746 67.25% Registered voters 546,834 Source: Ministry of the Interior
Candidate Party Coalition First round Votes % Giuseppe Pericu DS The Olive Tree 210,541 60.03 Rinaldo Magnani FI House of Freedoms 79,856 22.77 Sergio Castellaneta GN GN-LN 45,101 12.86 Others 15,230 4.34 Eligible voters 546,834 100.00 Voted 367,746 67.25 Blank or invalid ballots 17,018 Total valid votes 350,728
The election took place on 27–28 May 2007.
Results
Summary of the 2007 Genoa City Council election results Parties and coalitions Votes % Seats The Olive Tree (L'Ulivo ) 89,337 34.60% 22 Communist Refoundation Party (Rifondazione Comunista ) PRC 15,615 6.05% 3 Italy of Values (Italia dei Valori ) IdV 9,296 3.60% 2 Party of Italian Communists (Comunisti Italiani ) PdCI 6,447 2.50% 1 Federation of the Greens (Federazione dei Verdi ) FdV 5,768 2.23% 1 Others 11,272 4.36% 1 Vincenzi coalition (Centre-left ) 137,735 53.34% 30 Forza Italia FI 58,396 22.61% 12 Biasotti List (Lista Biasotti ) LB 18,724 7.25% 3 National Alliance (Alleanza Nazionale ) AN 16,117 6.24% 3 Lega Nord LN 9,340 3.62% 1 Union of the Centre (Unione di Centro ) UDC 8,170 3.16% 1 Pensioners' Party (Partito Pensionati ) PP 1,932 0.75% 0 Musso coalition (Centre-right ) 112,679 43.64% 20 Others 7,813 3.02% 0 Total 258,227 100.00% 50 Votes cast / turnout 328,289 61.75% Registered voters 523,529 Source: Ministry of the Interior
Candidate Party Coalition First round Votes % Marta Vincenzi DS The Olive Tree 158,238 51.21 Enrico Musso Ind House of Freedoms 142,081 45.98 Others 8,709 2.81 Eligible voters 523,529 100.00 Voted 323,289 61.75 Blank or invalid ballots 14,261 Total valid votes 309,028
The election took place on two rounds: the first on 6–7 May, the second on 20–21 May 2012.
Results
Summary of the 2012 Genoa City Council election results Parties and coalitions Votes % Seats Democratic Party (Partito Democratico ) PD 55,137 23.89% 12 Doria List (Lista Doria ) LD 26,784 11.60% 6 Italy of Values (Italia dei Valori ) IdV 13,730 5.95% 3 Left Ecology Freedom (Sinistra Ecologia Libertà ) SEL 11,606 5.03% 2 Federation of the Left (Federazione della Sinistra ) FdS 5,274 2.28% 1 Others 4,723 2.04% 0 Doria coalition (Centre-left ) 117,254 50.80% 24 Five Star Movement (Movimento Cinque Stelle ) M5S 32,516 14.09% 5 The People of Freedom (Il Popolo della Libertà ) PdL 21,251 9.21% 5 Others 8,655 3.75% 0 Vinai coalition (Centre-right ) 29,906 12.96% 5 Musso List (Lista Musso ) LM 28,818 12.49% 5 Lega Nord LN 10,042 4.35% 1 Others 12,274 5.31% 0 Total 230,810 100.00% 40 Votes cast / turnout 279,683 55.52% Registered voters 503,752 Source: Ministry of the Interior
Candidate Party Coalition First round Second round Votes % Votes % Marco Doria SEL PD -IdV -SEL -FdS 127,477 48.31 114,245 59.71 Enrico Musso Ind 39,589 15.00 77,084 40.29 Paolo Putti M5S 36,579 13.86 Pierluigi Vinai PdL 33,468 12.68 Edoardo Rixi LN 12,409 4.70 Others 14,327 5.45 Eligible voters 503,752 100.00 503,752 100.00 Voted 279,683 55.52 196,894 39.09 Blank or invalid ballots 15,834 5,565 Total valid votes 263,849 191,329
The election took place on two rounds: the first on 11 June, the second on 25 June 2017.
Results
Summary of the 2017 Genoa City Council election results Parties and coalitions Votes % Seats Lega Nord LN 28,194 12.96% 9 Genoa Wins (Vince Genova ) VG 21,243 9.76% 6 Forza Italia FI 17,582 8.08% 5 Brothers of Italy (Fratelli d'Italia ) FdI 11,490 5.28% 3 Direction Italy (Direzione Italia ) DI 4,638 2.13% 1 Bucci coalition (Centre-right ) 83,147 38.22% 24 Democratic Party (Partito Democratico ) PD 43,156 19.84% 7 Crivello List (Lista Crivello ) LC 20,601 9.47% 3 To Left (A Sinistra ) SI 6,598 3.03% 0 Others 6,933 3.19% 0 Crivello coalition (Centre-left ) 77,288 35.52% 10 Five Star Movement (Movimento Cinque Stelle ) M5S 39,971 18.37% 5 Call Me Genoa (Chiamami Genova ) CG 10,633 4.89% 1 Others 6,523 2.99% 0 Total 217,562 100.00% 40 Votes cast / turnout 237,679 48.39% Registered voters 491,167 Source: Ministry of the Interior
Candidate Party Coalition First round Second round Votes % Votes % Marco Bucci Ind LN -FI -FdI -DI 88,781 38.80 112,398 55.24 Giovanni Crivello PD PD -SI 76,407 33.40 91,057 44.76 Luca Pirondini M5S 41,347 18.07 Paolo Putti Ind 11,153 4.87 Others 11,108 4.86 Eligible voters 491,167 100.00 491,167 100.00 Voted 237,679 48.39 209,595 42.67 Blank or invalid ballots 8,883 6,140 Total valid votes 228,796 203,455
The election took place on 12 June 2022.
Results
Summary of the 2022 Genoa City Council election results Parties and coalitions Votes % Seats Bucci List (Lista Bucci ) LB 36,335 19.06% 9 Brothers of Italy (Fratelli d'Italia ) FdI 17,788 9.33% 4 Let's Change! (Cambiamo! ) C! 17,485 9.17% 4 Lega L 12,886 6.76% 3 Genoa Tomorrow (Genova Domani ) GD 8,952 4.70% 2 Forza Italia FI 7,340 3.85% 1 Union of the Centre (Unione di Centro ) UDC 3,752 1.97% 1 Others 656 0.35% 0 Bucci coalition (Centre-right ) 105,194 55.19% 24 Democratic Party (Partito Democratico ) PD 39,937 20.95% 10 Dello Strologo List (Lista Dello Strologo ) LDS 12,032 6.31% 2 Green Europe (Europe Verde ) EV 9,873 5.18% 2 Five Star Movement (Movimento Cinque Stelle ) M5S 8,381 4.40% 1 Italian Left (Sinistra Italiana ) SI 2,930 1.54% 0 Dello Strologo coalition (Centre-left ) 73,153 38.38% 15 United for the Constitution (Uniti per la Costituzione ) UpC 6,771 3.55% 1 Others 5,480 2.87% 0 Total 190,600 100% 40 Votes cast / turnout 212,199 44.17% Registered voters 480,424 Source: Ministry of the Interior
Candidate Party Coalition First round Votes % Marco Bucci Ind FI -L -FdI -C! -UDC -IV 112,457 55.49 Ariel Dello Strologo Ind PD -EV -SI -M5S 77,065 38.03 Mattia Crucioli Ind 7,221 3.56 Others 5,902 2.91 Eligible voters 480,424 100.00 Voted 212,199 44.17 Blank or invalid ballots 9,553 Total valid votes 202,646
The election took place on 25–26 May 2025.
Results
Summary of the 2025 Genoa City Council election results Parties and coalitions Votes % Seats Democratic Party (Partito Democratico ) PD 65,960 29.06% 14 Salis List (Lista Salis ) LS 18,853 8.31% 4 Greens and Left Alliance (Alleanza Verdi e Sinistra ) AVS 15,705 6.92% 3 Five Star Movement (Movimento Cinque Stelle ) M5S 11,583 5.10% 2 Reform Genoa (Riformiamo Genova ) RG 5,405 2.38% 1 Salis coalition (Centre-left ) 117,506 51.77% 24 Brothers of Italy (Fratelli d'Italia ) FdI 28,234 12.44% 6 Piciocchi List – Genoa Wins (Lista Piciocchi – Vince Genova ) LP 24,237 10.68% 4 Us Moderates (Noi Moderati ) NM 17,806 7.84% 3 Lega L 15,757 6.94% 2 Forza Italia FI 8,589 3.78% 1 Others 4,941 2.17% 0 Piciocchi coalition (Centre-right ) 99,564 43.86% 16 Others 9,927 4.37% 0 Total 226,997 100% 40 Votes cast / turnout 249,115 51.90% Registered voters 479,974 Source: Ministry of the Interior
Candidate Party Coalition First round Votes % Silvia Salis Ind PD -AVS -M5S -IV -A -Volt 124,720 51.48 Pietro Piciocchi FdI FdI -FI -L -NM -UDC 107,091 44.20 Others 10,449 4.32 Eligible voters 479,974 100.00 Voted 249,115 51.90 Blank or invalid ballots 6,855 Total valid votes 242,260
See also
Notes
References This article originated as a translation of this version of its counterpart in the Italian Wikipedia .