2005 Moldovan parliamentary election|
|
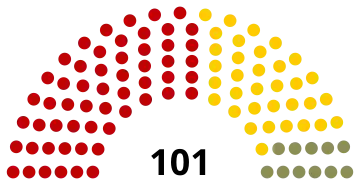
All 101 seats in Parliament
51 seats needed for a majority |
| Turnout | 68.84% ( 1.32pp) 1.32pp) |
|---|
| This lists parties that won seats. See the complete results below. |
Parliamentary elections were held in Moldova on 6 March 2005.[1] The result was a victory for the Party of Communists of the Republic of Moldova (PCRM), which won 56 of the 101 seats.[2]
Electoral system
The Parliament was elected by proportional representation in a single national constituency. In 2002 the electoral law was amended to change the electoral threshold, which had previously been at 3% for independent candidates and 6% for political parties and electoral blocs.[3] For electoral blocs of two parties it was raised to 9%, and for blocs of three or more, it was raised to 12%.[3]
Results
 |
|---|
| Party | Votes | % | Seats | +/– |
|---|
| Party of Communists | 716,336 | 45.98 | 56 | –15 |
| Electoral Bloc Democratic Moldova | 444,377 | 28.53 | 34 | – |
| Christian-Democratic People's Party | 141,341 | 9.07 | 11 | 0 |
| Electoral Bloc Motherland | 77,490 | 4.97 | 0 | 0 |
| Social Democratic Party | 45,551 | 2.92 | 0 | 0 |
| Republican Movement "Equality" | 44,129 | 2.83 | 0 | 0 |
| Party of Socio-Economic Justice | 25,870 | 1.66 | 0 | New |
| Christian Democratic Peasants' Party | 21,365 | 1.37 | 0 | 0 |
| Labour Union Party "Fatherland" | 14,399 | 0.92 | 0 | – |
| Centrist Union | 11,702 | 0.75 | 0 | New |
| Republican Party | 592 | 0.04 | 0 | New |
| Independents | 14,676 | 0.94 | 0 | 0 |
| Total | 1,557,828 | 100.00 | 101 | 0 |
|
| Valid votes | 1,557,828 | 98.84 | |
|---|
| Invalid/blank votes | 18,251 | 1.16 | |
|---|
| Total votes | 1,576,079 | 100.00 | |
|---|
| Registered voters/turnout | 2,430,537 | 64.84 | |
|---|
| Source: eDemocracy |
Results by administrative-territorial unit
| # | Administrative-territorial unit | Turnout | Party/electoral bloc |
| PCRM | BMD | PPCD | BePR | PSDM | MRR |
| 1 | Chișinău | 55.03% | 37.97% | 30.99% | 14.86% | 4.70% | 3.04% | 3.29% |
| 2 | Bălți | 57.45% | 40.83% | 22.95% | 5.37% | 7.84% | 3.50% | 13.51% |
| 3 | Anenii Noi | 68.37% | 51.52% | 24.21% | 9.13% | 3.70% | 4.50% | 0.68% |
| 4 | Basarabeasca | 82.01% | 57.49% | 21.93% | 3.88% | 4.28% | 1.90% | 0.52% |
| 5 | Briceni | 71.80% | 50.14% | 30.16% | 4.56% | 2.66% | 1.20% | 6.08% |
| 6 | Cahul | 69.04% | 39.08% | 31.83% | 14.60% | 3.13% | 3.11% | 3.74% |
| 7 | Cantemir | 78.40% | 49.52% | 32.58% | 8.28% | 1.18% | 2.60% | 0.12% |
| 8 | Călărași | 71.55% | 47.46% | 34.26% | 9.72% | 0.82% | 2.07% | 0.21% |
| 9 | Căușeni | 65.81% | 49.05% | 26.94% | 9.47% | 2.16% | 4.71% | 0.61% |
| 10 | Cimișlia | 72.49% | 61.09% | 19.30% | 8.42% | 1.55% | 2.64% | 0.31% |
| 11 | Criuleni | 67.31% | 48.45% | 32.92% | 9.83% | 0.95% | 2.26% | 0.29% |
| 12 | Donduseni | 68.43% | 55.19% | 21.97% | 5.36% | 2.48% | 2.58% | 6.54% |
| 13 | Drochia | 67.87% | 49.92% | 28.55% | 5.95% | 4.04% | 2.58% | 2.83% |
| 14 | Dubăsari | 66.56% | 69.04% | 19.02% | 3.45% | 1.66% | 2.64% | 0.20% |
| 15 | Edineț | 67.89% | 48.50% | 24.63% | 4.25% | 2.13% | 1.42% | 12.92% |
| 16 | Fălești | 73.82% | 56.45% | 26.49% | 4.74% | 3.01% | 3.02% | 1.61% |
| 17 | Floresti | 73.91% | 54.47% | 29.93% | 5.15% | 4.45% | 1.35% | 0.25% |
| 18 | Glodeni | 65.36% | 47.58% | 28.43% | 4.04% | 8.31% | 1.16% | 1.61% |
| 19 | Hîncești | 65.69% | 47.97% | 31.47% | 9.31% | 1.27% | 4.30% | 0.49% |
| 20 | Ialoveni | 62.73% | 43.74% | 35.96% | 12.27% | 0.80% | 1.88% | 0.17% |
| 21 | Leova | 74.49% | 49.64% | 33.38% | 8.49% | 2.00% | 0.80% | 0.49% |
| 22 | Nisporeni | 68.71% | 47.80% | 31.24% | 11.65% | 0.88% | 2.29% | 0.09% |
| 23 | Ocnița | 76.42% | 64.03% | 17.14% | 3.34% | 3.66% | 0.93% | 7.31% |
| 24 | Orhei | 64.31% | 41.15% | 33.95% | 10.24% | 1.38% | 5.53% | 0.42% |
| 25 | Rezina | 74.65% | 53.24% | 27.62% | 8.72% | 1.63% | 3.95% | 0.65% |
| 26 | Rîșcani | 71.01% | 46.17% | 29.32% | 5.86% | 5.07% | 2.38% | 4.37% |
| 27 | Sîngerei | 69.97% | 44.63% | 30.09% | 5.69% | 4.18% | 8.91% | 1.28% |
| 28 | Soroca | 68.47% | 51.29% | 31.38% | 5.06% | 2.01% | 2.99% | 1.96% |
| 29 | Strășeni | 65.96% | 41.92% | 33.24% | 12.33% | 0.91% | 1.86% | 0.13% |
| 30 | Șoldănești | 71.55% | 60.86% | 21.70% | 8.73% | 0.90% | 1.53% | 0.11% |
| 31 | Ștefan Vodă | 65.67% | 44.52% | 31.19% | 11.82% | 1.37% | 2.08% | 1.06% |
| 32 | Taraclia | 71.70% | 49.86% | 18.54% | 2.28% | 12.00% | 2.12% | 8.30% |
| 33 | Telenești | 71.96% | 42.32% | 38.49% | 9.41% | 0.68% | 4.51% | 0.04% |
| 34 | Ungheni | 66.54% | 53.30% | 27.64% | 6.72% | 2.37% | 3.27% | 1.25% |
| 35 | U.T.A. Găgăuzia | 60.64% | 30.75% | 6.09% | 0.81% | 51.48% | 0.95% | 5.34% |
| 36 | Transnistria | — | 31.42% | 41.59% | 8.41% | 6.01% | 6.95% | 1.49% |
| 37 | Diplomatic missions (Moldovan diaspora) | 61.76% | 11.61% | 43.11% | 32.32% | 4.92% | 3.82% | 0.72% |
| |
| Total | 64.84% | 45.98% | 28.53% | 9.07% | 4.97% | 2.92% | 2.83% |
See also
References
- ^ Dieter Nohlen & Philip Stöver (2010) Elections in Europe: A data handbook, p1330 ISBN 978-3-8329-5609-7
- ^ Nohlen & Stöver, p1342
- ^ a b Nohlen & Stöver, p1322

