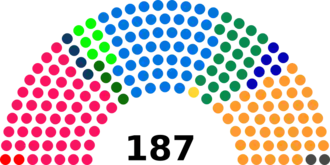
Federal elections were held in Switzerland on 27 October 1935.[1] The Social Democratic Party emerged as the largest party in the National Council, winning 50 of the 187 seats.[2]
Results
National Council
 |
|---|
| Party | Votes | % | Seats | +/– |
|---|
| Social Democratic Party | 255,843 | 28.01 | 50 | +1 |
| Free Democratic Party | 216,664 | 23.72 | 48 | –4 |
| Conservative People's Party | 185,052 | 20.26 | 42 | –2 |
| Party of Farmers, Traders and Independents | 100,300 | 10.98 | 21 | –9 |
| Alliance of Independents | 37,861 | 4.14 | 7 | New |
| Liberal Democratic Party | 30,476 | 3.34 | 6 | 0 |
| Young Farmers | 28,161 | 3.08 | 4 | New |
| National Front | 13,740 | 1.50 | 1 | New |
| Communist Party | 12,569 | 1.38 | 2 | 0 |
| Liberal Socialist Party | 11,078 | 1.21 | 0 | New |
| Social-Political Group | 10,665 | 1.17 | 3 | +1 |
| Evangelical People's Party | 6,780 | 0.74 | 1 | 0 |
| National Union | 4,334 | 0.47 | 1 | New |
| General People's List | 1 | New |
| Other parties | 0 | – |
| Total | 913,523 | 100.00 | 187 | 0 |
|
| Valid votes | 913,523 | 97.62 | |
|---|
| Invalid/blank votes | 22,233 | 2.38 | |
|---|
| Total votes | 935,756 | 100.00 | |
|---|
| Registered voters/turnout | 1,194,910 | 78.31 | |
|---|
| Source: Mackie & Rose,[3] Nohlen & Stöver |
By constituency
| Constituency | Seats | Electorate | Turnout | Party | Votes | Seats
won |
| Aargau | 12 | 72,982 | 65,837 | | Social Democratic Party | 271,446 | 4 |
| | Conservative People's Party | 166,454 | 3 |
| | Party of Farmers, Traders and Independents | 121,180 | 2 |
| | Free Democratic Party | 132,635 | 2 |
| | Young Farmers | 36,481 | 1 |
| | Evangelical People's Party | 28,117 | 0 |
| Appenzell Ausserrhoden | 2 | 13,702 | 10,849 | | Social Democratic Party | 10,634 | 1 |
| | Free Democratic Party | 4,975 | 1 |
| | Party of Farmers, Traders and Independents | 4,184 | 0 |
| Appenzell Innerrhoden | 1 | 3,404 | 2,391 | | Conservative People's Party | 1,244 | 1 |
| Basel-Landschaft | 4 | 27,020 | 17,822 | | Social Democratic Party | 22,344 | 2 |
| | Free Democratic Party | 18,749 | 2 |
| | Party of Farmers, Traders and Independents | 6,949 | 0 |
| | Liberal Socialist Party | 7,919 | 0 |
| | Conservative People's Party | 7,618 | 0 |
| | Young Farmers | 3,336 | 0 |
| | Communist Party | 3,003 | 0 |
| | Action Committee for Interest Reduction | 388 | 0 |
| Basel-Stadt | 7 | 49,161 | 35,357 | | Social Democratic Party | 90,404 | 3 |
| | Liberal Democratic Party | 38,630 | 1 |
| | Free Democratic Party | 33,747 | 1 |
| | Communist Party | 28,530 | 1 |
| | Conservative People's Party | 26,362 | 1 |
| | Party of Farmers, Traders and Independents | 19,874 | 0 |
| | Liberal Socialist Party | 7,367 | 0 |
| Bern | 31 | 211,533 | 158,138 | | Social Democratic Party | 1,642,382 | 11 |
| | Party of Farmers, Traders and Independents | 1,451,157 | 11 |
| | Free Democratic Party | 659,820 | 4 |
| | Young Farmers | 490,181 | 3 |
| | Conservative People's Party | 257,971 | 1 |
| | Ring of Independents | 141,883 | 1 |
| | Liberal Socialist Party | 121,249 | 0 |
| | National Front | 75,276 | 0 |
| Fribourg | 7 | 40,416 | 31,752 | | Conservative People's Party | 146,587 | 5 |
| | Free Democratic Party | 54,497 | 0 |
| | Social Democratic Party | 18,893 | 2 |
| Geneva | 8 | 48,044 | 32,026 | | Social Democratic Party | 106,117 | 3 |
| | Free Democratic Party | 49,227 | 2 |
| | Liberal Democratic Party | 41,777 | 1 |
| | Conservative People's Party | 29,693 | 1 |
| | National Union | 21,655 | 1 |
| | Communist Party | 5,242 | 0 |
| | New National Political Order | 478 | 0 |
| Glarus | 2 | 10,147 | 8,223 | | Free Democratic Party | 4,404 | 1 |
| | Social Democratic Party | 4,372 | 0 |
| | Social-Political Group | 4,006 | 1 |
| | Conservative People's Party | 3,375 | 0 |
| Grisons | 6 | 34,326 | 27,093 | | Conservative People's Party | 55,718 | 3 |
| | Social-Political Group | 44,696 | 2 |
| | Free Democratic Party | 35,919 | 1 |
| | Social Democratic Party | 21,844 | 0 |
| Lucerne | 9 | 57,540 | 48,544 | | Conservative People's Party | 220,461 | 5 |
| | Free Democratic Party | 148,850 | 3 |
| | Social Democratic Party | 59,349 | 1 |
| Neuchâtel | 6 | 36,216 | 25,453 | | Social Democratic Party | 69,047 | 3 |
| | Free Democratic Party | 36,773 | 2 |
| | Liberal Democratic Party | 35,374 | 1 |
| | National Progressive Party | 7,277 | 0 |
| Nidwalden | 1 | 4,284 | 2,960 | | Conservative People's Party | 1,585 | 1 |
| Obwalden | 1 | 5,327 | 2,678 | | Conservative People's Party | 1,543 | 1 |
| Schaffhausen | 2 | 14,351 | 13,055 | | Social Democratic Party | 10,514 | 1 |
| | Free Democratic Party | 6,178 | 1 |
| | Party of Farmers, Traders and Independents | 5,395 | 0 |
| | National Front | 3,087 | |
| Schwyz | 3 | 17,912 | 13,404 | | Conservative People's Party | 20,678 | 2 |
| | Free Democratic Party | 11,082 | 1 |
| | Social Democratic Party | 7,892 | 0 |
| Solothurn | 7 | 43,523 | 36,213 | | Free Democratic Party | 109,975 | 3 |
| | Social Democratic Party | 74,351 | 2 |
| | Conservative People's Party | 63,018 | 2 |
| St. Gallen | 13 | 74,437 | 65,565 | | Conservative People's Party | 314,870 | 5 |
| | Free Democratic Party | 217,856 | 4 |
| | Social Democratic Party | 149,748 | 2 |
| | Ring of Independents | 66,571 | 1 |
| | General People's List | 28,953 | 1 |
| | Young Farmers | 27,747 | 0 |
| Ticino | 7 | 42,503 | 31,606 | | Free Democratic Party | 104,980 | 3 |
| | Conservative People's Party | 79,659 | 3 |
| | Social Democratic Party | 33,795 | 1 |
| Thurgau | 6 | 38,283 | 31,290 | | Party of Farmers, Traders and Independents | 43,168 | 2 |
| | Social Democratic Party | 50,243 | 2 |
| | Conservative People's Party | 34,301 | 1 |
| | Free Democratic Party | 33,007 | 1 |
| | Young Farmers | 14,793 | 0 |
| | Young Thurgau List | 4,867 | 0 |
| Uri | 1 | 6,460 | 3,978 | | Free Democratic Party | 3,007 | 1 |
| Vaud | 15 | 100,819 | 76,759 | | Free Democratic Party | 416,231 | 6 |
| | Social Democratic Party | 322,373 | 4 |
| | Liberal Democratic Party | 207,626 | 3 |
| | Party of Farmers, Traders and Independents | 129,885 | 2 |
| | Communist Party | 23,780 | 0 |
| | Independent Progressive Party | 22,033 | 0 |
| Valais | 6 | 38,879 | 31,181 | | Conservative People's Party | 115,862 | 4 |
| | Free Democratic Party | 40,344 | 1 |
| | Social Democratic Party | 26,512 | 1 |
| | Helvetic Action List | 3,447 | 0 |
| Zug | 2 | 9,815 | 7,066 | | Conservative People's Party | 6,495 | 1 |
| | Free Democratic Party | 3,800 | 1 |
| | Social Democratic Party | 3,236 | 0 |
| Zürich | 28 | 195,724 | 156,506 | | Social Democratic Party | 1,282,080 | 9 |
| | Ring of Independents | 788,261 | 5 |
| | Party of Farmers, Traders and Independents | 567,477 | 4 |
| | Free Democratic Party | 434,764 | 3 |
| | Social-Political Group | 300,315 | 2 |
| | Conservative People's Party | 272,157 | 2 |
| | National Front | 158,978 | 1 |
| | Communist Party | 154,105 | 1 |
| | Evangelical People's Party | 124,235 | 1 |
| | Liberal Socialist Party | 115,787 | 0 |
| | Young Farmers | 108,623 | 0 |
| |
| Source: Bundesblatt, 4 December 1935 |
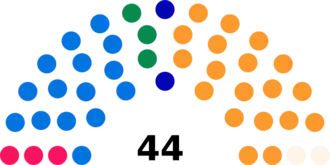
Council of the States
In several cantons the members of the Council of the States were chosen by the cantonal parliaments.[4]
By canton
References
- ^ Nohlen, D & Stöver, P (2010) Elections in Europe: A data handbook, p1894 ISBN 9783832956097
- ^ Nohlen & Stöver, p1953
- ^ Thomas T Mackie & Richard Rose (1991) The International Almanac of Electoral History, Macmillan
- ^ Nohlen & Stöver, p1956
.svg.png)