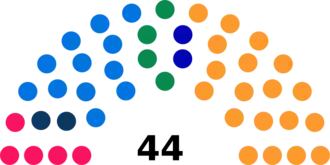
Federal elections were held in Switzerland on 31 October 1943.[1] The Social Democratic Party emerged as the largest party in the National Council, winning 56 of the 194 seats.[2]
Results
National Council
 |
|---|
| Party | Votes | % | Seats | +/– |
|---|
| Social Democratic Party | 251,576 | 28.60 | 56 | +11 |
| Free Democratic Party | 197,746 | 22.48 | 47 | –2 |
| Conservative People's Party | 182,916 | 20.79 | 43 | 0 |
| Party of Farmers, Traders and Independents | 101,998 | 11.59 | 22 | 0 |
| Alliance of Independents | 48,557 | 5.52 | 7 | –2 |
| Social-Political Group | 29,627 | 3.37 | 5 | 0 |
| Liberal Democratic Party | 28,434 | 3.23 | 8 | +2 |
| Young Farmers | 18,310 | 2.08 | 3 | 0 |
| Liberal Socialist Party | 9,031 | 1.03 | 0 | –1 |
| Evangelical People's Party | 3,627 | 0.41 | 1 | +1 |
| Other parties | 7,918 | 0.90 | 2 | +2 |
| Total | 879,740 | 100.00 | 194 | +7 |
|
| Valid votes | 879,740 | 96.86 | |
|---|
| Invalid/blank votes | 28,506 | 3.14 | |
|---|
| Total votes | 908,246 | 100.00 | |
|---|
| Registered voters/turnout | 1,296,706 | 70.04 | |
|---|
| Source: Mackie & Rose,[3] Nohlen & Stöver |
By constituency
| Constituency | Seats | Electorate | Turnout | Party | Votes | Seats
won |
| Aargau | 12 | 81,680 | 70,634 | | Social Democratic Party | 292,459 | 5 |
| | Conservative People's Party | 165,210 | 3 |
| | Free Democratic Party | 148,715 | 2 |
| | Party of Farmers, Traders and Independents | 137,535 | 2 |
| | Ring of Independents | 35,693 | 0 |
| | Young Farmers | 25,795 | 0 |
| Appenzell Ausserrhoden | 2 | Elected unopposed | | Free Democratic Party | | 1 |
| | Social Democratic Party | | 1 |
| Appenzell Innerrhoden | 1 | 3,488 | 1,755 | | Conservative People's Party | 1,520 | 1 |
| Basel-Landschaft | 4 | 29,333 | 18,447 | | Social Democratic Party | 25,370 | 2 |
| | Free Democratic Party | 12,260 | 1 |
| | Social-Political Group | 12,829 | 1 |
| | Ring of Independents | 12,302 | 0 |
| | Conservative People's Party | 9,476 | 0 |
| Basel-Stadt | 8 | 53,333 | 35,358 | | Social Democratic Party | 97,050 | 3 |
| | Liberal Democratic Party | 58,980 | 2 |
| | Free Democratic Party | 44,932 | 1 |
| | Ring of Independents | 33,100 | 1 |
| | Conservative People's Party | 29,926 | 1 |
| | Liberal Socialist Party | 7,216 | 0 |
| Bern | 33 | 233,129 | 160,259 | | Social Democratic Party | 1,890,855 | 13 |
| | Party of Farmers, Traders and Independents | 1,615,361 | 11 |
| | Free Democratic Party | 784,181 | 5 |
| | Young Farmers | 333,117 | 2 |
| | Conservative People's Party | 306,410 | 2 |
| | Liberal Socialist Party | 113,922 | 0 |
| | Ring of Independents | 113,698 | 0 |
| Fribourg | 7 | 45,000 | 31,013 | | Conservative People's Party | 134,184 | 5 |
| | Free Democratic Party | 46,730 | 1 |
| | Social Democratic Party | 24,983 | 1 |
| | Party of Farmers, Traders and Independents | 8,211 | 0 |
| Geneva | 8 | 53,303 | 19,168 | | Free Democratic Party | 54,550 | 3 |
| | Liberal Democratic Party | 36,466 | 2 |
| | Conservative People's Party | 30,955 | 2 |
| | Social Democratic Party | 22,462 | 1 |
| Glarus | 2 | 10,693 | 8,176 | | Social Democratic Party | 6,093 | 1 |
| | Free Democratic Party | 3,957 | 1 |
| | Social-Political Group | 3,630 | 0 |
| | Conservative People's Party | 2,172 | 0 |
| Grisons | 6 | 37,111 | 27,396 | | Social-Political Group | 63,109 | 3 |
| | Conservative People's Party | 55,543 | 2 |
| | Free Democratic Party | 22,623 | 1 |
| | Social Democratic Party | 17,075 | 0 |
| Lucerne | 9 | 63,050 | 51,067 | | Conservative People's Party | 218,276 | 5 |
| | Free Democratic Party | 159,315 | 3 |
| | Social Democratic Party | 46,706 | 1 |
| | Ring of Independents | 17,338 | 0 |
| | Party of Farmers, Traders and Independents | 11,702 | 0 |
| Neuchâtel | 5 | 38,868 | 22,170 | | Social Democratic Party | 49,905 | 2 |
| | Free Democratic Party | 32,102 | 2 |
| | Liberal Democratic Party | 25,753 | 1 |
| Nidwalden | 1 | 5,446 | 3,823 | | Conservative People's Party | 2,256 | 1 |
| | Others | 1,506 | 0 |
| Obwalden | 1 | 6,129 | 4,202 | | Conservative People's Party | 2,421 | 1 |
| | Others | 1,642 | 0 |
| Schaffhausen | 2 | 16,526 | 14,881 | | Social Democratic Party | 14,254 | 1 |
| | Free Democratic Party | 9,071 | 1 |
| | Party of Farmers, Traders and Independents | 4,939 | 0 |
| Schwyz | 3 | 19,444 | 13,688 | | Farmers Association | 12,247 | 1 |
| | Conservative People's Party | 10,671 | 1 |
| | Free Democratic Party | 9,542 | 1 |
| | Social Democratic Party | 7,582 | 0 |
| Solothurn | 7 | 48,418 | 39,704 | | Free Democratic Party | 99,559 | 3 |
| | Social Democratic Party | 85,348 | 2 |
| | Conservative People's Party | 66,977 | 2 |
| | Ring of Independents | 10,248 | 0 |
| | Party of Farmers, Traders and Independents | 8,188 | 0 |
| St. Gallen | 13 | 79,723 | 63,865 | | Conservative People's Party | 307,482 | 5 |
| | Free Democratic Party | 213,315 | 4 |
| | Social Democratic Party | 149,969 | 2 |
| | Ring of Independents | 57,139 | 1 |
| | Young Farmers | 30,378 | 1 |
| | Association of Free Democrats | 29,465 | 0 |
| Ticino | 7 | 45,624 | 33,592 | | Conservative People's Party | 81,410 | 3 |
| | Free Democratic Party | 70,725 | 2 |
| | Social Democratic Party | 51,703 | 2 |
| | Social-Political Group | 23,117 | 0 |
| Thurgau | 6 | 41,470 | 31,581 | | Social Democratic Party | 58,652 | 2 |
| | Party of Farmers, Traders and Independents | 46,166 | 2 |
| | Conservative People's Party | 38,010 | 1 |
| | Free Democratic Party | 34,479 | 1 |
| | Young Farmers | 6,879 | 0 |
| Uri | 1 | 8,144 | 3,686 | | Free Democratic Party | 2,924 | 1 |
| Vaud | 16 | 106,274 | 57,927 | | Free Democratic Party | 371,719 | 8 |
| | Social Democratic Party | 198,282 | 3 |
| | Liberal Democratic Party | 181,686 | 3 |
| | Party of Farmers, Traders and Independents | 100,593 | 2 |
| | Ring of Independents | 39,170 | 0 |
| | Labor List | 6,198 | 0 |
| Valais | 7 | 43,094 | 32,872 | | Conservative People's Party | 131,385 | 5 |
| | Free Democratic Party | 47,942 | 1 |
| | Social Democratic Party | 37,366 | 1 |
| | Valais People's List | 9,146 | 0 |
| Zug | 2 | 10,926 | 7,278 | | Conservative People's Party | 5,975 | 1 |
| | Social Democratic Party | 4,541 | 1 |
| | Free Democratic Party | 3,274 | 0 |
| Zürich | 31 | 216,549 | 155,565 | | Social Democratic Party | 1,655,010 | 12 |
| | Party of Farmers, Traders and Independents | 665,668 | 5 |
| | Ring of Independents | 550,575 | 4 |
| | Free Democratic Party | 542,072 | 4 |
| | Conservative People's Party | 366,942 | 2 |
| | Social-Political Group | 363,548 | 2 |
| | Independent-Free List | 214,569 | 1 |
| | Liberal Socialist Party | 113,547 | 0 |
| | Evangelical People's Party | 112,441 | 1 |
| | List of Free Economic Action | 31,488 | 0 |
| | Young Farmers | 80,263 | 0 |
| |
| Source: Bundesblatt, 23 November 1943 |
Council of the States
In several cantons the members of the Council of the States were chosen by the cantonal parliaments.[4]
References
- ^ Nohlen, D & Stöver, P (2010) Elections in Europe: A data handbook, p1895 ISBN 9783832956097
- ^ Nohlen & Stöver, p1953
- ^ Thomas T Mackie & Richard Rose (1991) The International Almanac of Electoral History, Macmillan
- ^ Nohlen & Stöver, p1956
.svg.png)