2006 United States House of Representatives elections in Kansas Majority party Minority party Party Republican Democratic Last election 3 1 Seats won 2 2 Seat change Popular vote 459,267 369,191 Percentage 54.34% 43.68% Swing
District results County results Republican
40–50%
50–60%
60–70%
70–80%
80–90%
>90%
Democratic
40–50%
50–60%
60–70%
80–90%
The 2006 United States House of Representatives elections in Kansas were held on November 7, 2006, to determine who will represent the state of Kansas in the United States House of Representatives . Kansas has four seats in the House, apportioned according to the 2000 United States census . Representatives are elected for two-year terms.
Overview United States House of Representatives elections in Kansas, 2006[ 1] Party Votes Percentage Seats +/– Republican 459,267 54.34% 2 -1 Democratic 369,191 43.68% 2 +1 Reform 16,669 1.97% 0 — Totals 845,127 100.00% 4 —
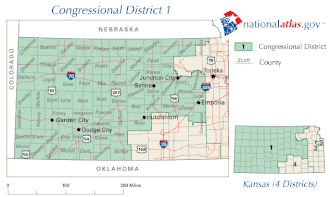
District 1 Incumbent Republican Jerry Moran defeated Democrat John Doll , a history professor. This district covers the western part of the state.
Predictions
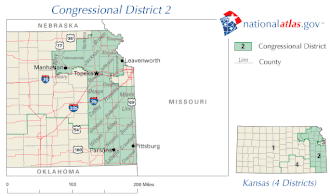
District 2 2006 Kansas's 2nd congressional district election County resultsBoyda: 40–50% 50–60% 60–70%Ryun: 40–50% 50–60% 60–70%
Incumbent Republican Jim Ryun lost re-election to Democrat Nancy Boyda , a chemist. The district covers the eastern part of the state.
Predictions
District 3 Incumbent Democrat Dennis Moore defeated Republican Chuck Ahner, a businessman. The district covers the Metro Kansas City area.
Predictions
District 4 Incumbent Republican Todd Tiahrt defeated Democrat Garth McGinn. This district covers the metro Wichita area.
Predictions
References ^ "Office of the Clerk, U.S. House of Representatives" .^ a b c d "2006 Competitive House Race Chart" (PDF) . House: Race Ratings . Cook Political Report. November 6, 2006. Archived from the original on September 27, 2007. Retrieved November 20, 2023 .^ a b c d "2006 House Ratings" . House Ratings . The Rothenberg Political Report. November 6, 2006. Archived from the original on November 7, 2006. Retrieved November 20, 2023 .^ a b c d "2006 House" . Sabato's Crystal Ball. November 6, 2006. Archived from the original on November 10, 2006. Retrieved November 20, 2023 .^ a b c d "Battle for the House of Representatives" . realclearpolitics.com . Real Clear Politics. November 7, 2006. Archived from the original on November 9, 2006. Retrieved December 12, 2023 .^ a b c d "Balance of Power Scorecard: House" . cqpolitics.com . Congressional Quarterly Inc. Archived from the original on November 17, 2006. Retrieved November 20, 2023 .
U.S. U.S. (election ) Governors Attorneys State officials State Mayors Anaheim, CA Anchorage, AK Austin, TX Fort Lauderdale, FL Irvine, CA Long Beach, CA Louisville, KY Newark, NJ New Orleans, LA Richmond, CA San Bernardino, CA San Jose, CA Norfolk, VA Oakland, CA Providence, RI Santa Ana, CA Sioux Falls, SD Tallahassee, FL Tulsa, OK Washington, DC Local Orange County, FL St. Charles County, MO St. Louis County, MO States


.JPG)